| Victory International Futures |
|---|
| Daily Market Suggestion – 13 Maret 2026 |
NASDAQ100
OHLC – DAILY
| THURSDAY | |
|---|---|
| Open | 24943.75 |
| High | 24943..75 |
| Low | 34516.50 |
| Close | 24566.00 |
ECONOMIC CALENDAR
| DAYS | CUR | WIB | REVIEW | FORECAST | PREV |
|---|---|---|---|---|---|
FRIDAY | USD | 19.30 | Core PCE Price Index m/m | 0.4% | 0.4% |
USD | 19.30 | Prelim GDP q/q | 1.4% | 1.4% | |
USD | 19.30 | Core Durable Goods Orders m/m | 0.5% | 1.0% | |
USD | 19.30 | Durable Goods Orders m/m | 1.1% | -1.4% | |
USD | 19.30 | Preli GDP Price Index q/q | 3.6% | 3.6% | |
USD | 19.30 | Personal Income m/m | 0.5% | 0.3% | |
USD | 19.30 | Personal Spending m/m | 0.3% | 0.4% |
TRADING SUGGEST
| DAYS | BUY/SELL | TP | SL | |
|---|---|---|---|---|
MONDAY | SELL | 24841.75 | 24641.75 | 25041.75 |
TUESDAY | BUY | 24666.00 | 24866.00 | 24466.00 |
WEDNESDAY | BUY | 24982.25 | 25182.25 | 24782.25 |
THURSDAY | SELL | 24984.00 | 24784.00 | 25184.00 |
FRIDAY | SELL | 24751.50 | 24551.50 | 24951.50 |
SUPPORT – RESISTANCE
| RESISTANCE | R3 | 25396.75 |
|---|---|---|
| R2 | 25170.25 | |
| R1 | 24969.50 | |
| PIVOT | 24743.00 | |
| SUPPORT | S1 | 24542.25 |
| S2 | 24315.75 | |
| S3 | 24155.00 |
MARKET RIVIEW
| ANALISIS | REVIEW |
|---|---|
| FUNDAMENTAL | Wall Street Turun Tajam saat Harga Minyak Melonjak https://investor.id/market/431812/wall-street-turun-tajam-saat-harga-minyak-melonjak#goog_rewarded |
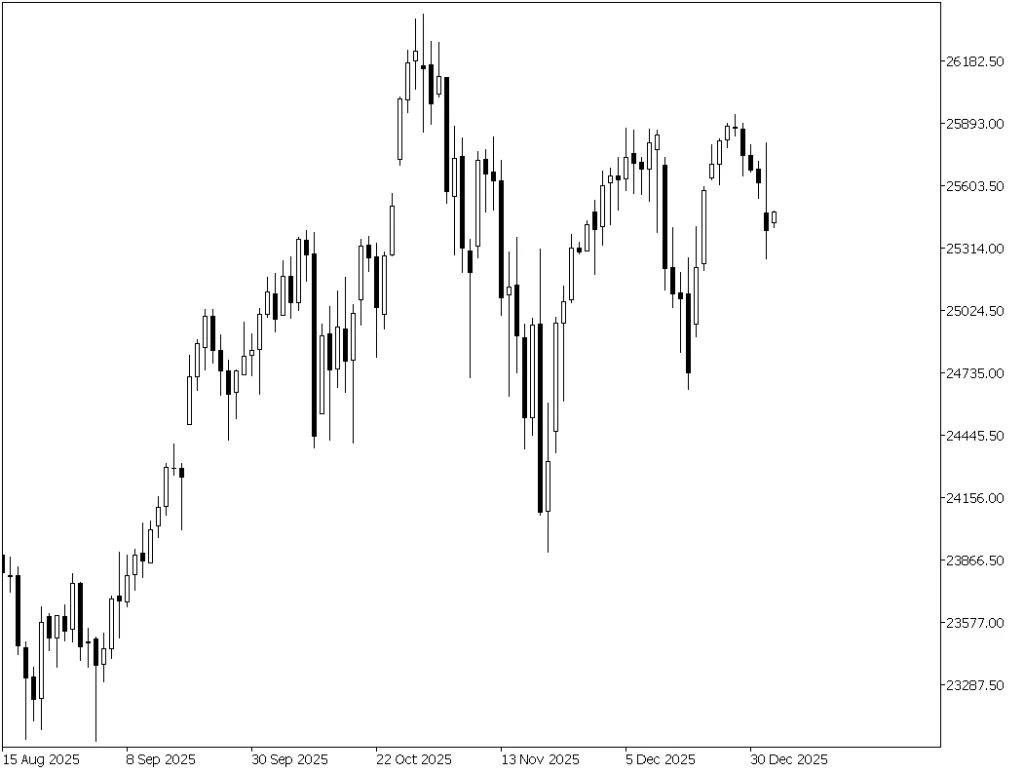
| TECHNICAL | MACD berada di bawah level -100 interval H1 indikasi Bearish |
DISCLAIMER:
Analisis ini hanya sebuah informasi dan tidak ada keharusan untuk diikuti. Segala tindakan / keputusan yang anda ambil merupakan tanggung jawab penuh atas diri anda sendiri,
